Settings
To open the Studio configuration window, go to File > Settings:
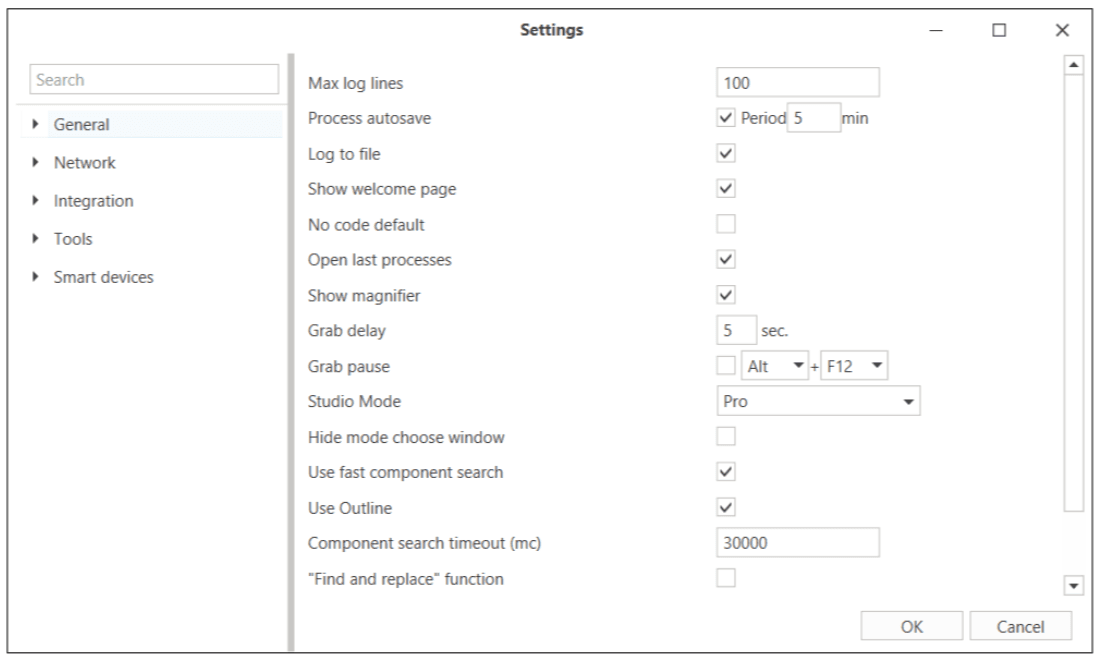
Settings are grouped into the following categories:
-
General (basic settings)
- Debugger – configuration of the debugging tool.
- Appearance – Studio interface appearance.
- Elements – element management.
-
Network
- NuGet – configuration of allowed NuGet package sources.
- Reverse Proxy – traffic interception settings.
- Orchestrator – connection settings for Orchestrator.
-
Tools
- Extensions – browser extension settings.
-
Integration
- Manages integration with SAP and Java applications.
-
Smart devices
- Android – settings for integration with Android devices.
General
-
Max log lines – maximum number of lines displayed in the Console panel.
-
Process autosave – automatically saves all open processes to temporary files. You can set the autosave period in minutes.
-
Log to file – saves Studio logs to a file. Example path:
C:\Users\UserName\AppData\Local\Primo.Primo Studio\Log\<day month year hour>_RobotStudio.log. -
Show welcome page – shows the welcome screen when Studio starts.
-
No code default – sets No code mode as default for new elements.
-
Open last processes – reopens the most recently opened project processes at startup.
-
Show magnifier – displays the selector magnifier in the upper corner when choosing UI elements.
-
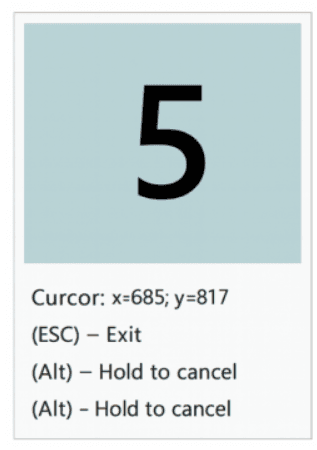
Grab delay – sets the delay (in seconds) before capturing a UI element. Default: 5 sec (available from version 1.25.1).
-
Grab pause – defines hotkeys to pause element capture. Default: Alt + F12 for a 10-second pause. Useful for opening context menus before capturing a specific item.
-
Studio Mode – selects the working mode:
- Pro – for advanced users building complex business processes and test scenarios.
- Citizen – simplified mode for users with little or no coding experience.
-
Hide mode choose window – hides the Studio Mode selection window at startup.
-
Use fast component search – enables fast search by default for desktop application templates (does not affect existing templates).
-
Use Outline – specifies whether to display the process hierarchy in the Outline panel. You can also quickly navigate to any process element by double-clicking its name.
- Checked – use the outline. If the panel is not visible, go to the main menu View > Panels > Outline to show it.
- Unchecked – do not use the outline.

-
Component search timeout (mc) – maximum time (in milliseconds) for searching a UI element in the Search Template Editor window. Default:
30 000 ms. If the element is not found within this time, the search stops and displays an error message:
-
“Find and replace” function – adds a replace option to the Search window to substitute found text across the project.
Debugger
The Debugger is a tool for finding and fixing errors in processes created in Primo RPA Studio. It allows you to pause execution at key points, analyze variable values, and step through actions to detect and eliminate logic issues. A detailed description of debugger buttons and menu functions is available via the provided link.
-
Debugger type – defines which robot is used during debugging. Possible values:
- ROBOT – default. Debugging runs on a real robot included in the Studio distribution.
- SEQUENCE – intended only for Studio technical specialists. Starts debugging without a robot (experimental setting).
-
Close robot – specifies whether the robot should automatically close after debugging ends. Enabled by default. Disable if you need to inspect the robot console afterward (for example, to diagnose a Studio connection issue).
-
Show robot console – determines whether to display the robot console during debugging. If unchecked, the console is hidden and the robot closes automatically after the project runs.

-
Minimize Studio – defines whether to minimize the Studio window during debugging.
-
Show console window – determines whether to display a semi-transparent Studio console window during debugging. This floating window shows logs even when Studio is minimized.

-
Check syntax – enables automatic syntax checking. Disabling this option speeds up debugging in large projects.
-
C# syntax validation algorithm – lets you choose the C# syntax checking engine. You can switch between the Actipro-based algorithm and the classic Microsoft CodeAnalysis algorithm (default). Available since version 1.24.8.
-
Trace enabled – when enabled, Studio receives detailed step-by-step execution data from the robot. Required to display values in the Current value column of the Variables and Arguments panels. Disabling speeds up debugging in large projects.
-
Log to file – saves the robot log to a file. Example path:
C:\Users\UserName\AppData\Local\Primo.Primo Studio\Log. Possible file names:<day month year hour>_Default_Robot.log– robot log without debug data.<day month year hour>_Default_Robot1.log– contains debug data.
-
Log custom to file – saves custom user events (triggered by the Write to log element) to a file. Such files include custom in the name, for example:
<day month year hour>_Default_Robot1_custom.log. -
Show Output – displays the Output panel for detailed variable inspection. Works only when Tracing is enabled. To view values, set a breakpoint on the element following the variable to capture. When the breakpoint is reached, the Output tab appears in the Project panel.
-
Realtime variables values – determines whether current variable values are displayed in the Variables and Arguments panels during debugging. Works only with Tracing. Does not affect values shown in the Output panel. Disabling can speed up debugging in large projects.
-
Pause debugging on exception – automatically pauses the process when an exception occurs during debugging, allowing you to inspect the error and manually retry the element without restarting the whole process. If unchecked, debugging restarts from the beginning.
-
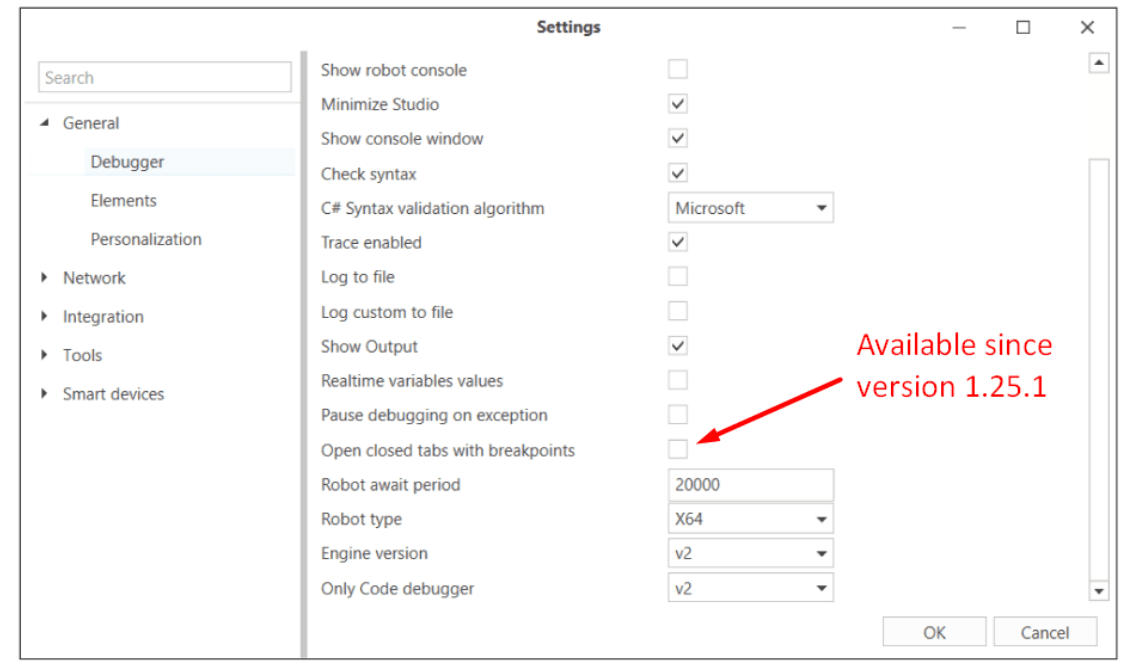
Open closed tabs on breakpoint – automatically reopens closed .ltw tabs that have breakpoints set. Disabled by default. Available since version 1.25.1.
-
Robot await period – maximum time (ms) to wait for the robot to start during debugging.
-
Robot type – choose x64 or x86.
-
Engine version – select v1 or v2. Version v2 loads processes faster during debugging and is recommended by default for high-load projects.
-
Only Code Debugger – select the debugger robot core: v1 or v2. Added in version 1.23.11.
If you change the debugger core:
- Restart Studio after making the change.
- If the project contains breakpoints created in code (v1), remove them and create new ones (v2) to avoid compatibility issues.
- Remember that v2 does not support uninitialized variables.
Advantages of v2:
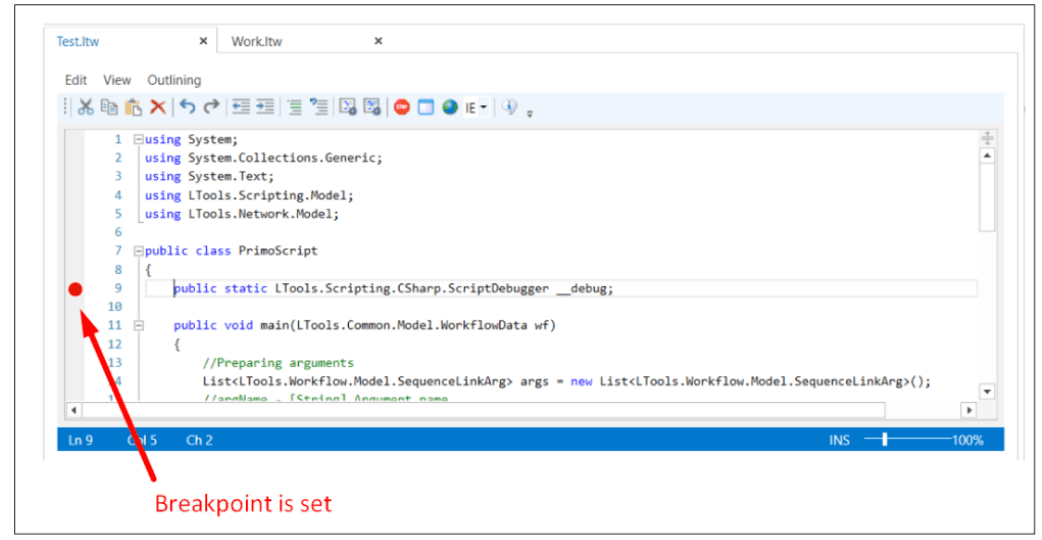
- Uses color indicators instead of code for breakpoints (see illustration below).
- Lets you view the current values of local function variables at a breakpoint. In v1, only class-level variable values are visible in the Output panel.
- Allows you to navigate directly to the function code at a breakpoint.
- Provides a single action to remove all breakpoints from a process using the Remove all breakpoints button on the Debug tab.
Personalization
-
Theme – selects the Studio color scheme.
-
Language – selects the interface language. Restart Studio after changing.
-
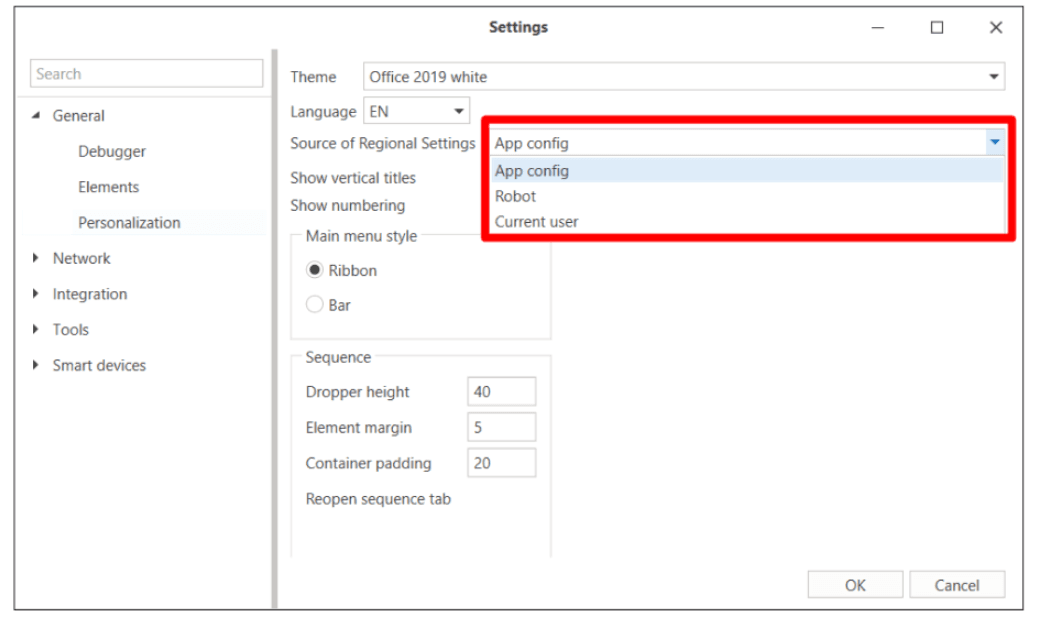
Regional settings (CultureInfo) – manages date, number, and other formats independently of the operating system:
- App config – default value.
- Robot – uses robot settings.
- Current user – matches the OS settings.
-
Show vertical headers – displays vertical headers for sequence containers.
-
Show numbering – controls automatic numbering of elements inside sequences. Enabled by default.
- To show element numbers in the Console panel, right-click the column headers in the console table, select Show column chooser, and check Number.
-
Main menu style – chooses how to display the main menu:
- Ribbon – modern ribbon layout (recommended).
- Bar – classic panel layout (legacy).
-
Sequence – fine-tunes the appearance of sequence diagrams. When you change these settings, reopen the sequence tab for the changes to take effect:
- Insertion height – default
40. - Element offset – default
5. - Container offset – default
20.
- Insertion height – default
Elements

-
Hide Generation 1 – hides Generation 1 components (outdated browser and desktop elements) in the Elements panel. Keeps the panel clean.
-
Disable logging for new items – controls default logging for newly added elements:
- Checked – disables logging by default.
- Unchecked – logging remains enabled by default. No Studio restart required.
-
Use old search pattern editor as default – enables the previous version of the search pattern editor. New search pattern is vailable since version 23.9.
-
Use old table wizard – activates the old table-reading wizard. Disabled by default. Available since version 1.25.1.
-
Show workflow elements design – displays frequently used element properties directly on the process element in a diagram. Enabled by default. Available since version 1.25.1.
-
Elements version – selects the rendering version for elements (for example, v2) to show key properties on the element panel. Available since version 1.25.1.
-
Hide Desktop Anywhere and RDP – hides elements related to Desktop Anywhere and RDP in the Attach to Application activity. Enabled by default. Available since version 1.25.5.
Network
NuGet
The tab is intended for connecting custom NuGet package sources. Detailed instructions for working with this tab are described here.
You can also specify a local NuGet server, included with the Orchestrator package, as a source.
Reverse-Proxy
Settings for working with the traffic interception network:
- Port — the port used by the interceptor.
- Autoregister as default proxy — when interception starts, the interceptor automatically registers itself as the system proxy server.
- Capture SSL — enables interception and decryption of SSL/TLS packets.
- Capture incoming — enables interception of responses to requests.
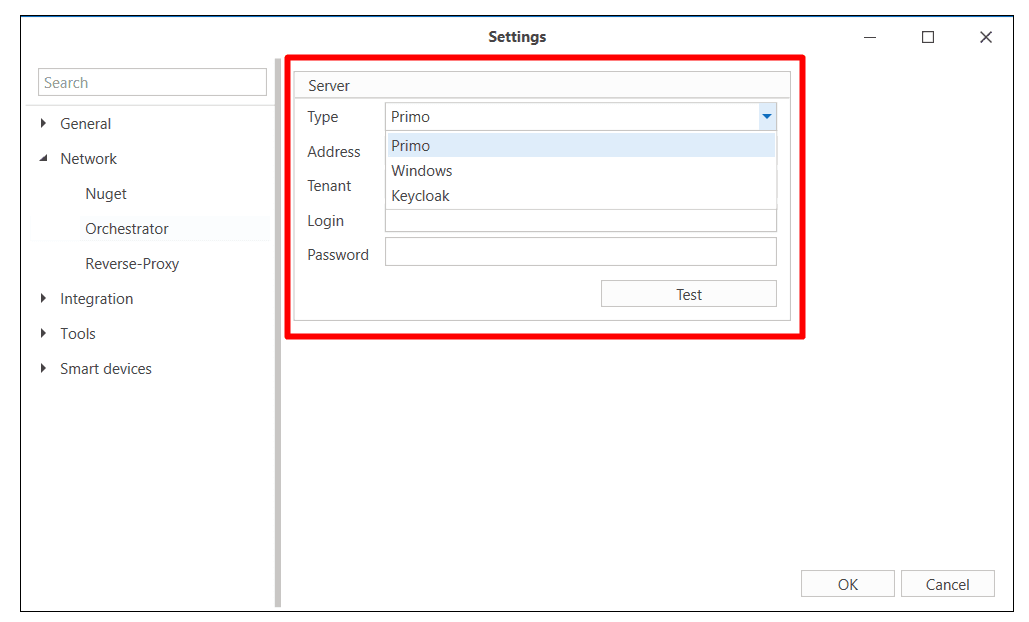
Orchestrator connection
Settings for connecting Studio to the Orchestrator (not available for the Community edition).
Standard connection (Primo)
-
Open Studio and go to Settings.
-
Select Network → Orchestrator.
-
In the Type dropdown list, select Primo and specify:
- Address — Orchestrator server address.
- Tenant — user tenant.
- Login — user login.
- Password — user password.
-
Click Test to check the connection.
-
Click OK to save the settings.
The connection status indicator is always visible in the lower-right corner of the Studio main window.

Clicking the indicator provides quick access to the connection settings.
Connection using AD authorization
-
Open Studio and go to Settings.
-
Select Network → Orchestrator.
-
In the Type dropdown list, select Windows (available since version 1.24.10).
-
Enter the required Orchestrator server address.
-
Click Test to check the connection.
-
Click OK to save the settings.
Note: Make sure that the necessary Active Directory (AD) groups are added to system roles such as Robot or Studio in the Orchestrator to enable operations.
Connection using Keycloak authorization
-
Open Studio and go to Settings.
-
Select Network → Orchestrator.
-
In the Type dropdown list, select Keycloak (available since version 1.25.5).

-
Enter the required Orchestrator server address.
-
Click Test to check the connection.
-
Click OK to save the settings.
Note: When using Keycloak authorization, add Keycloak to the existing system roles Robot / Studio through the role-editing form in the Orchestrator.
Integration
AI
To set up integration with AI:
-
Contact your sales manager for information on how to get the
Primo.AI.Plugin.dllplugin. Download the plugin and add it to the Studio folder.
-
Restart Studio to display Integration → AI in the settings.
-
In the settings, enable Use AI and select a language model:
-
Sber GPT – integration with GigaChat (default).
-
Yandex GPT.

-
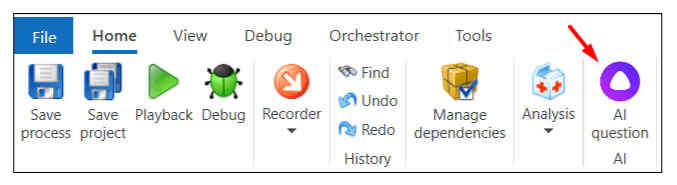
This enables AI chat support — the AI request button will appear in the Studio menu.
Specify the remaining parameters for the selected AI:
For instructions on how to obtain the token and other required data, see the Integration with AI section.
Sber GPT
- Token – access token for GPT, valid for 30 minutes after issue.
- Key – same value as Token.
- Time-out – maximum wait time for a GigaChat response in milliseconds (default 20000 ms).
- Creativity – response creativity from 0 to 1 (higher values give more unpredictable results, default 0.5).
Yandex GPT
- Folder ID – Yandex Cloud folder ID.
- Token – IAM token for GPT (valid for up to 12 hours; request more often if possible).
- Time-out – maximum wait time for a Yandex GPT response in milliseconds (default 20000 ms).
- Max Length – maximum total length of request + response in characters (default 4000, must not exceed 4700).
- Creativity – response creativity from 0 to 1 (higher values give more unpredictable results, default 0.5).
- Chat name – default Primo User.
Java
Settings for integration with the Java plugin. Make sure the plugin is installed.
- Deep search – searches for UI elements in Java applications in detail.
SAP
Settings for the SAP integration inspector:
- Time-out – maximum connection wait time in milliseconds (default 10000).
- x64 – enables x64 architecture support for SAP applications.
Tools
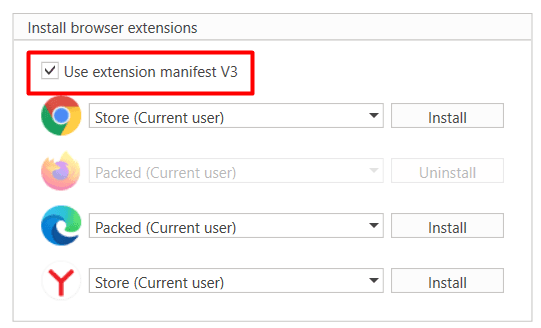
Extensions
The section is designed for installing browser extensions and plugins.
Detailed installation instructions are provided in the following articles:
- Installing extensions and plugins from the command line
- Manual installation of extensions and plugins from the Studio interface
- Automatic installation of browser extensions
When installing browser extensions for Chrome, Edge, or Yandex, you can choose the Manifest version used by the extension:
- If the checkbox Use Manifest V3 is enabled, the extension will be installed based on Manifest V3 .
- If the checkbox is disabled (default), the standard extension based on Manifest V2 will be installed.
Switching to an extension that works with Manifest V3 can be done until June 2025. Currently, installing an extension based on Manifest V3 is only possible manually, without using scripts.
Smart devices
Android
Settings for integration with Android-based mobile devices:
- ADB path – path to the Android Device Bridge (ADB) installation folder.