Working with Code
Studio allows you to develop automation scenarios in Pure code mode.
To do this, when creating a scenario (or process), select the Code only type (1) and specify the programming language (2):
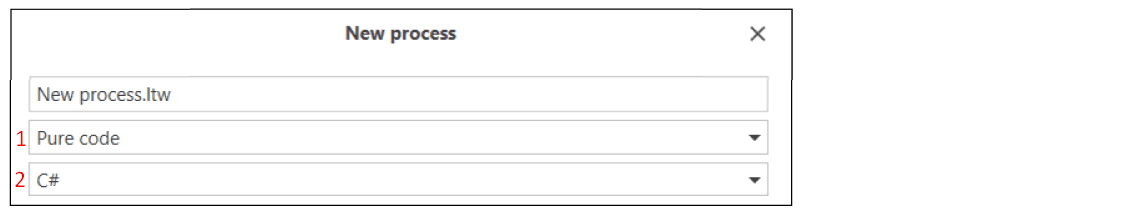
By default, C# is used, but you can choose Python or JavaScript instead.
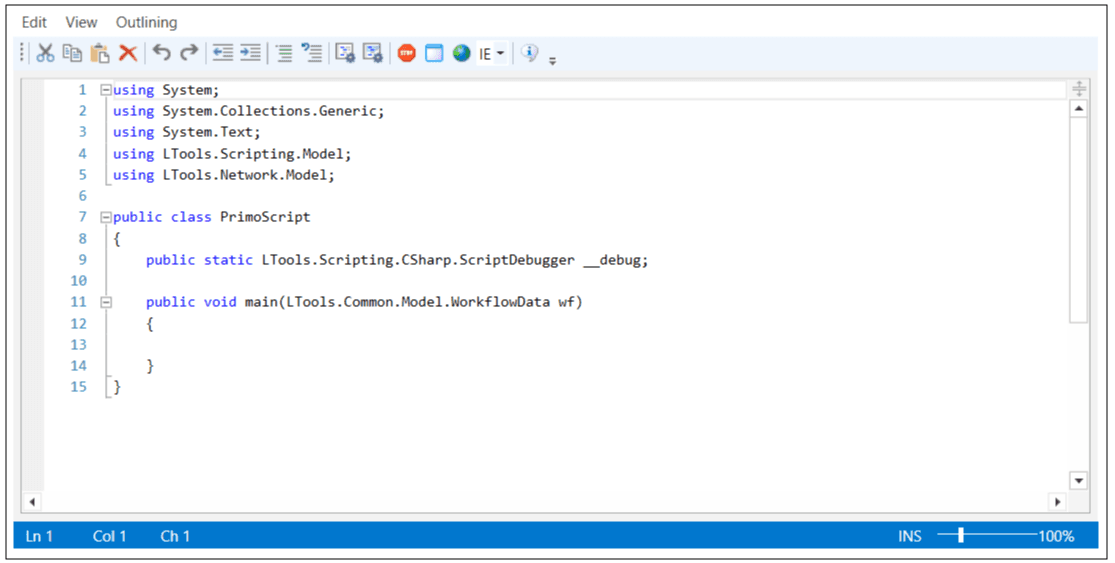
After creating the process, the code editor opens, allowing you to work with the elements:
How to add an element to the process
On the Project panel, find the desired component and drag it into the code editor - a sample will be created for its call.
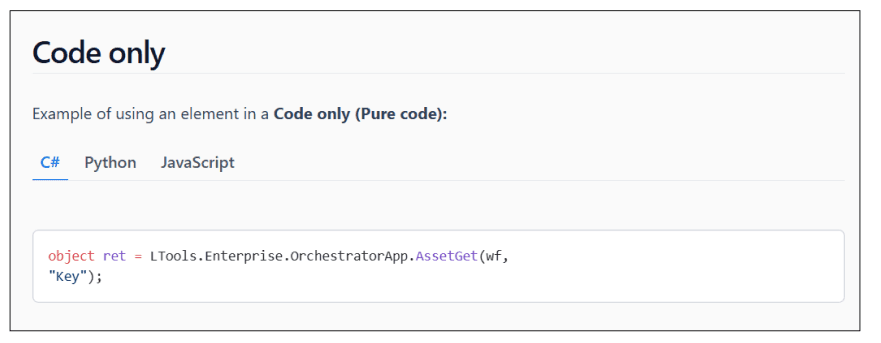
In the sections dedicated to describing elements, you can usually find a Pure code subsection - it contains examples of using elements in pure code. See the example for the Get value element:
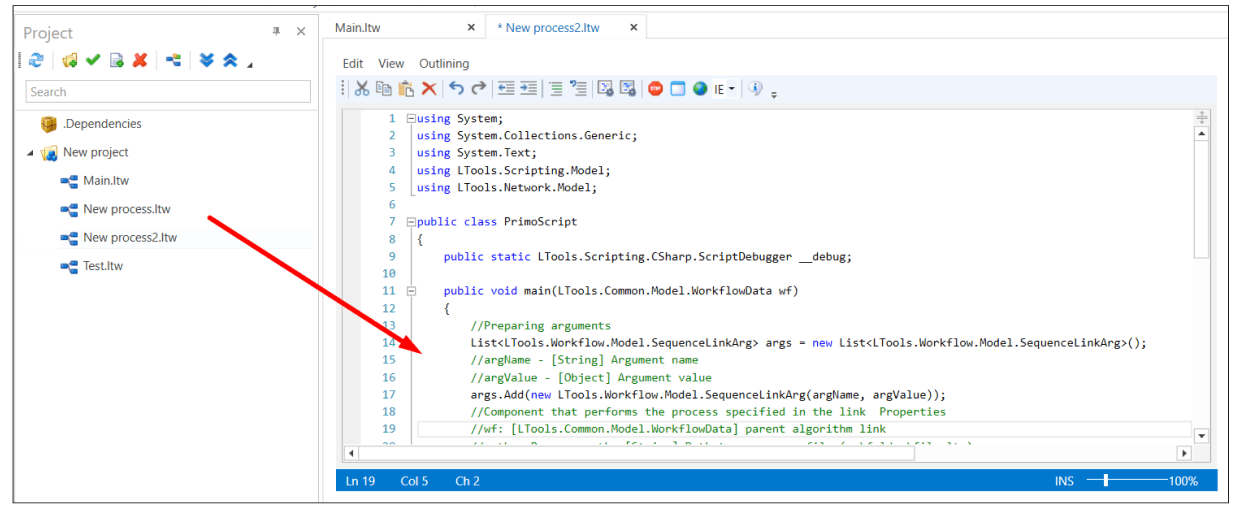
How to call another process inside a process
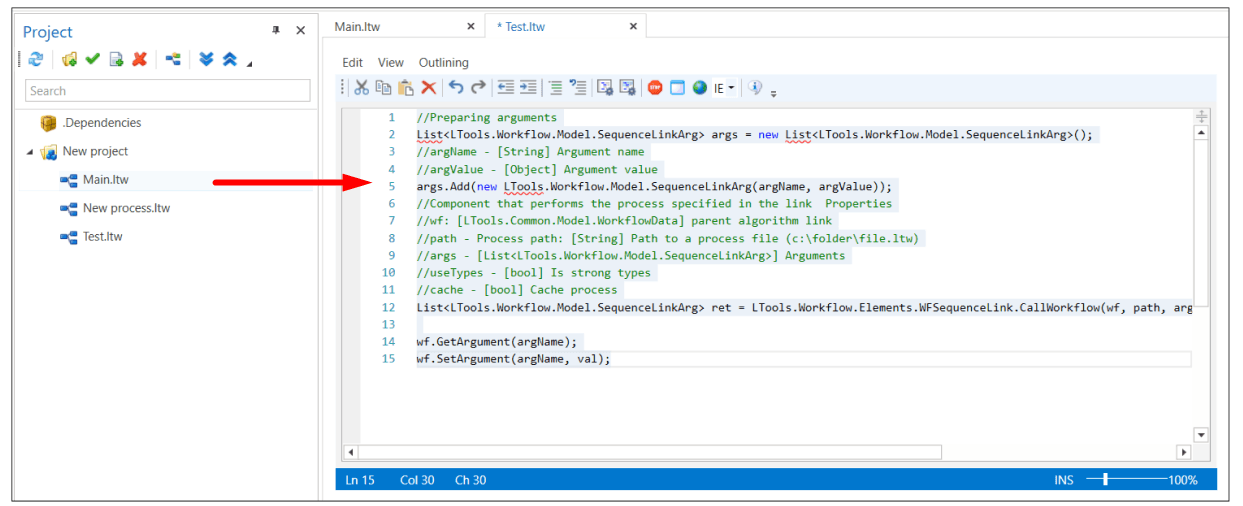
To call another process, drag the corresponding process file from the Project panel into the code.
How to use arguments
The code supports arguments - variables for exchanging data between processes. Working with them is no different from other types of processes. You can also use the GetArgument and SetArgument methods of the global wf variable to work with arguments.
How to create a search pattern
There are buttons in the code editor menu ![]() - use them to create a search pattern for the control element. If you need to edit the pattern, select it in the code and also use one of these buttons.
- use them to create a search pattern for the control element. If you need to edit the pattern, select it in the code and also use one of these buttons.
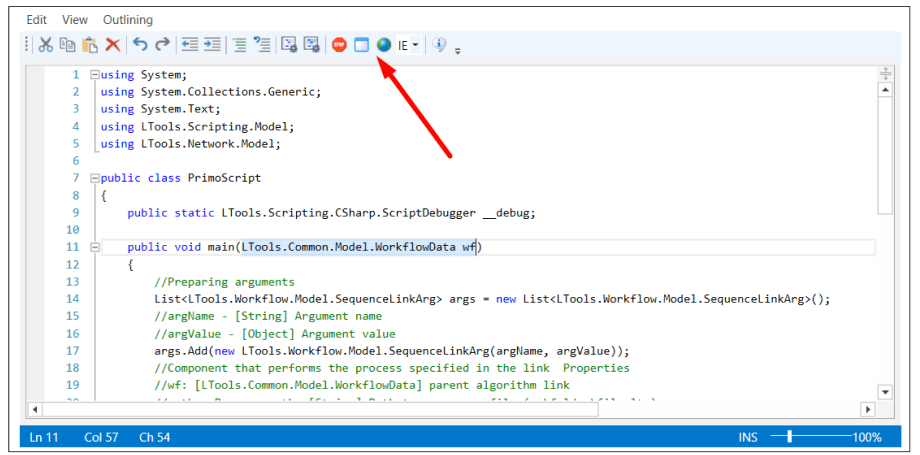
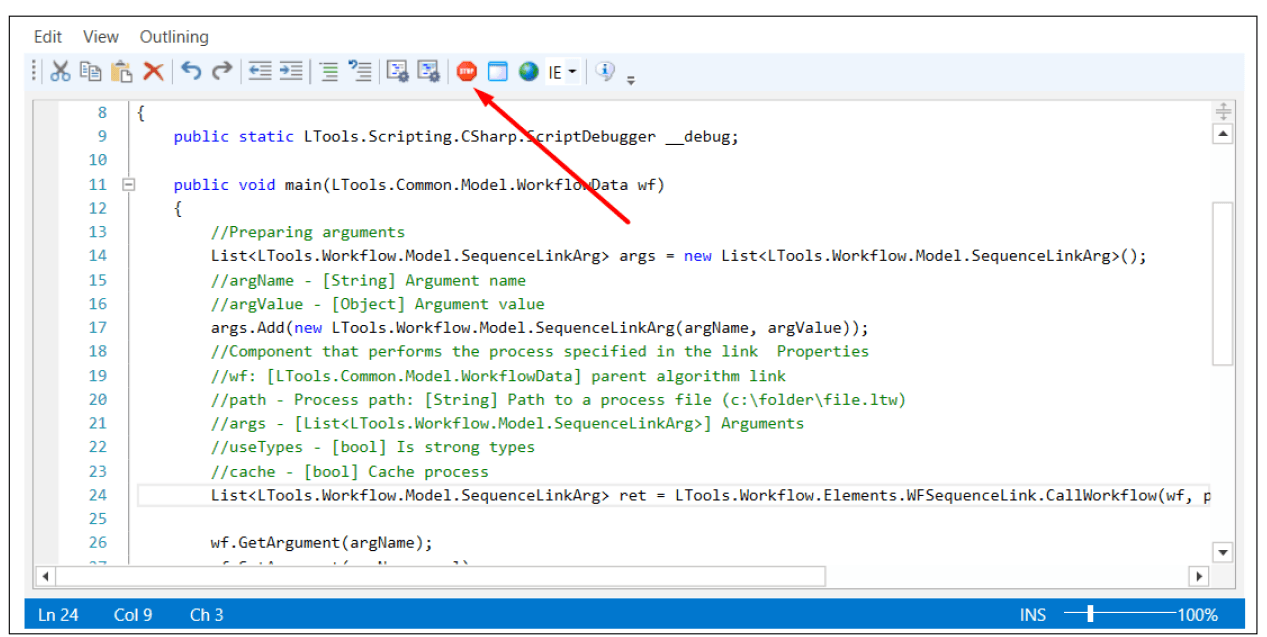
How to set a breakpoint
Click the Stop button in the code editor menu:
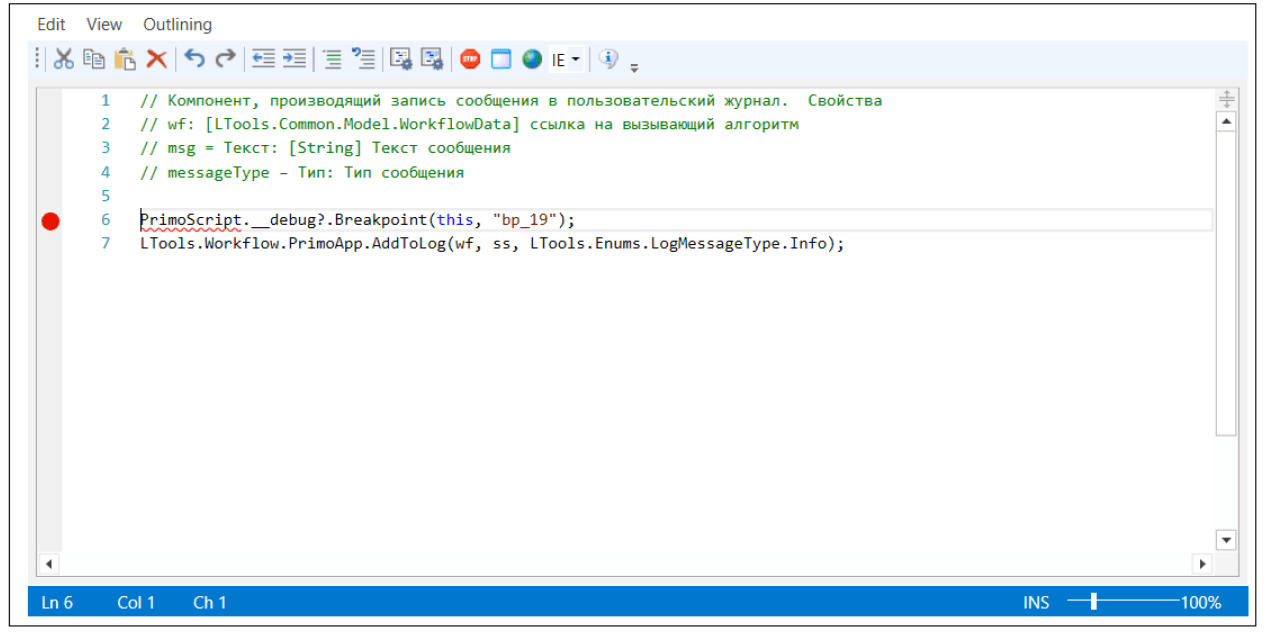
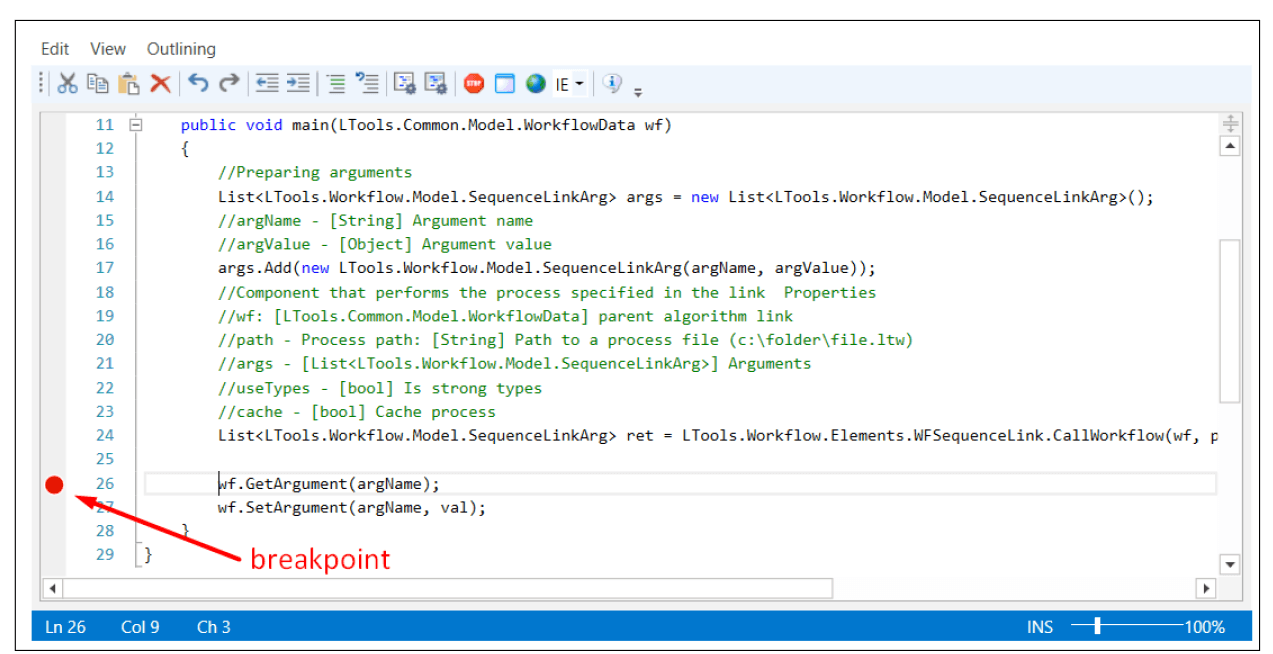
A line calling the breakpoint will appear in the code:
In Python and JavaScript, the last parameter is responsible for the line number of the breakpoint.
Please note that in Studio version 23.11, a version v2 core has been implemented for the pure code debugger. Its advantages include:
- Color indicators are now used for breakpoints instead of code (see the figure below).
- The current values of local function variables are now visible. In core version v1, only the current values of class variables are displayed in the Output panel.
- It is possible to go to the function code at the breakpoint.
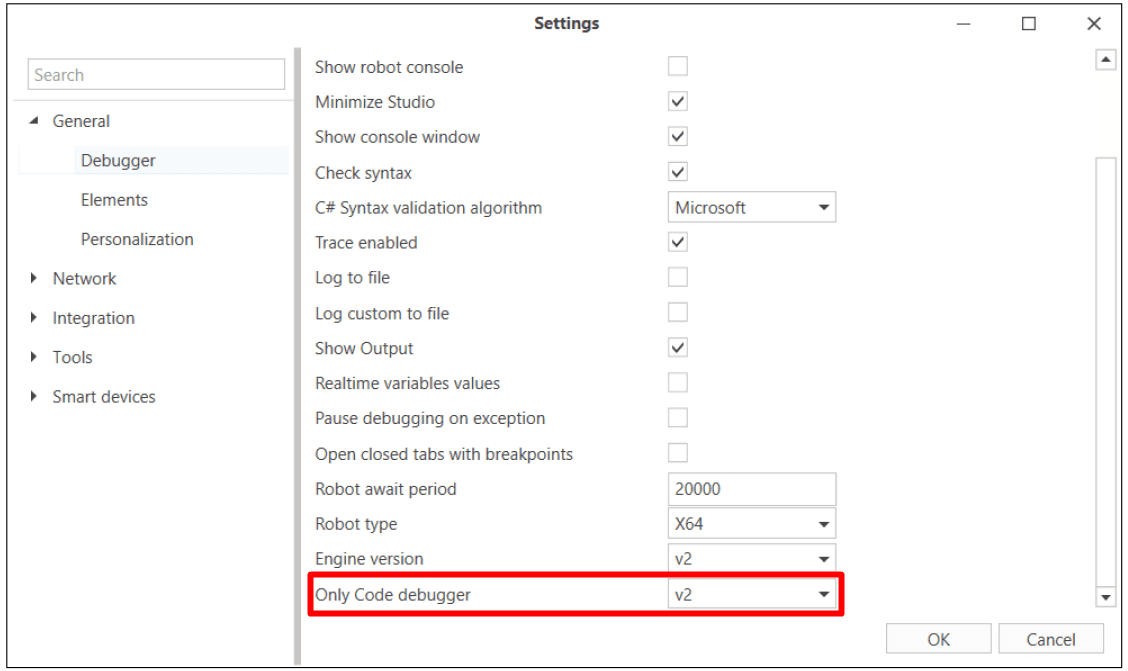
You can select the Pure code debugger core in the Studio settings window. By default, version v1 is used.
- If you change the core version, be sure to restart Studio.\
- If you change the core in projects where breakpoints were set in code (v1), remove them and create new ones (v2) to avoid compatibility issues.\
- You cannot use uninitialized variables with the v2 debugger.
Where to view the current variable value during debugging
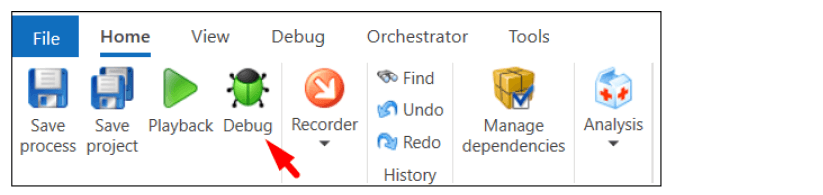
Add a breakpoint to the desired element and use the Debug command:
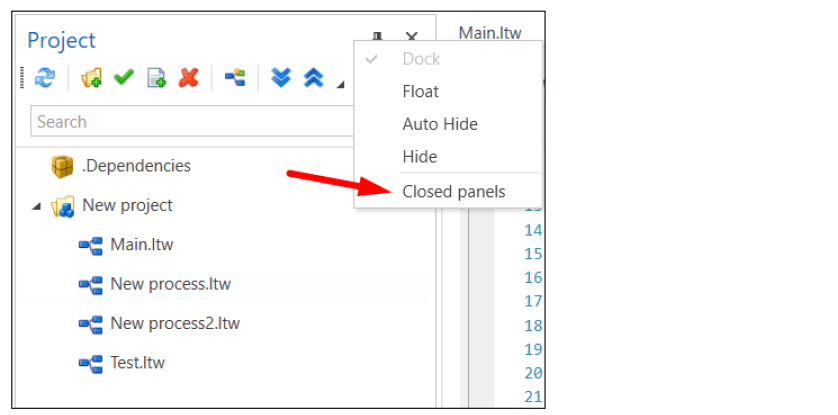
In the Project panel, open the context menu and select Closed panels:
Click the Output button that appears under the Project panel:

Go to the Output panel by clicking the corresponding button at the bottom:
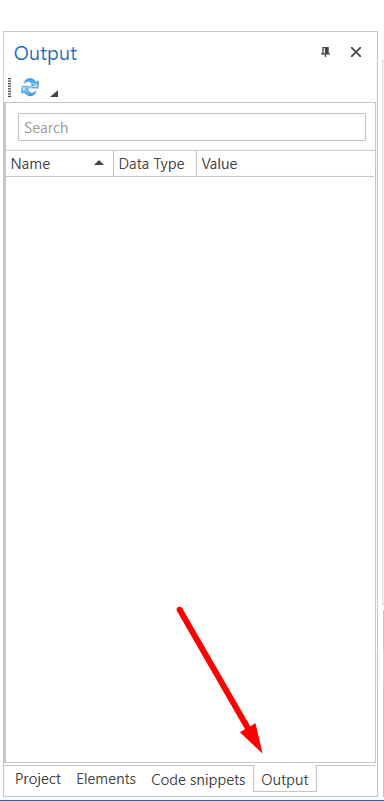
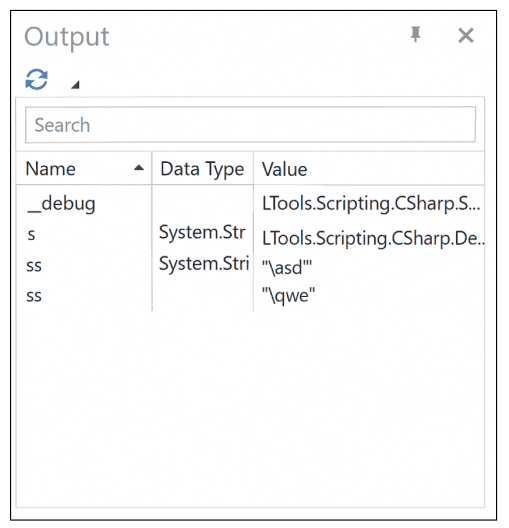
View the state of variables at the moment when code execution is paused.
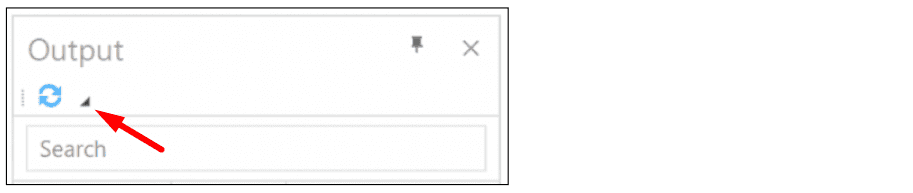
If incorrect data is displayed in the Output panel - for example, from the last debugging in sequence mode - simply click the Refresh button:
Starting with Primo RPA Studio version 1.24.6, a Pause button has been added for processes of the Pure code type. This function allows you to interrupt the process execution at the required moment, which increases the accuracy of control.
Limitations
Depending on the selected language, the formatting rules and working with the code will differ. For example, in C#, a special variable __debug will be created, responsible for working with the debugger.
Also, the following limitations exist in the languages:
- In Python, only variables whose names start with an underscore character are displayed in the Variables panel.
- JavaScript does not support displaying variables and the Watch panel.
- The Watch panel only works with visible variables.